
Mastering Function Graphs with Geogebra
Keen on mapping out a mathematical function f(x) on a Cartesian grid using Geogebra? I'll walk you through the process.
Both Geogebra's desktop application and its online platform are at your disposal.
Creating a Graph with Geogebra on Your PC
Launch Geogebra on your PC and select the arrow in the upper left corner.
Enter the mathematical function you aim to graph into the Input field.
For example, type in x^2.
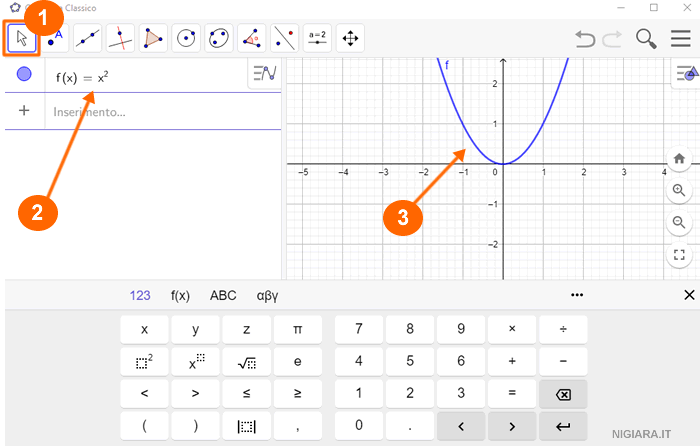
Watch as the graph materializes in real-time on the right side of the screen.
Adding Another Function? To display multiple functions on the same graph, input the second function in the Input field, keeping the first one intact.
Alternatively, Geogebra allows you to sketch the function graph manually without having to define the function's formula.
Charting a Graph with Geogebra Online
Head over to the official Geogebra site.
From the homepage, click the Draw a Graph button or choose the Graphing Calculator feature lower on the page. A Cartesian plane interface will open.
Input the mathematical function f(x) you wish to plot in the Input field.
As an example, input the formula (x+1)/(1-x).
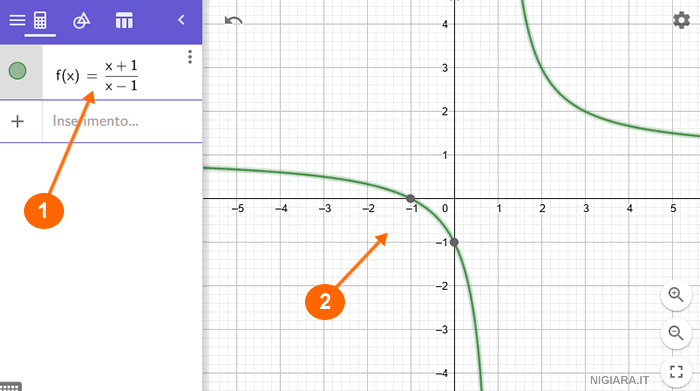
The function's graph is instantly plotted on the diagram.
Graphing Multiple Functions Together?
To overlay another function on the same graph, simply enter the new function in the Input field, just below the first one.
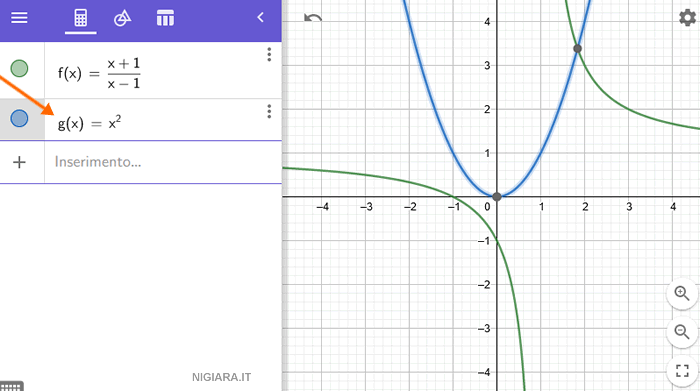
This approach is straightforward and efficient.
Note: This tutorial was crafted using a Windows OS PC and Google Chrome browser. The steps remain consistent across different browsers and operating systems.


