
Scatter Plots in R
Let's explore the world of scatter plots with R.
Introduction to Scatter Plots Scatter plots are indispensable tools for investigating relationships between two quantitative variables. In R, crafting such plots is remarkably simple.
A Real-World Example.
Consider you're analyzing two datasets: one reflects the study hours of students, and the other their examination scores.
In R, we use vectors to represent these study hours and scores.
study_hours <- c(2, 4, 5, 7, 8, 9, 10, 12)
scores <- c(5, 6, 7, 7, 8, 9, 9, 10)
Curious about a potential correlation between these variables? Scatter plots are your go-to for visualizing such relationships.
To create a scatter plot in R, simply utilize the plot() function.
plot(study_hours, scores, main="Study Hours vs. Scores: A Correlational Study", xlab="Study Hours", ylab="Scores", pch=19)
This command enhances plot visibility with pch=19, adds a descriptive title with main, and labels the axes with xlab and ylab.
Executing this code reveals a scatter plot, displaying data pairs across a plane, vividly illustrating the study hours and scores relationship.
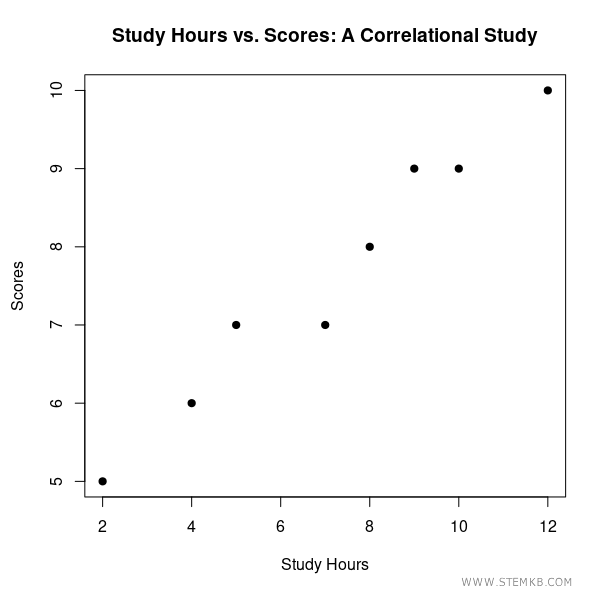
An upward trend from left to right suggests a positive correlation: higher study hours correlate with higher scores.
A cornerstone of statistics: correlation does not equal causation, but it can hint at a potential relationship.
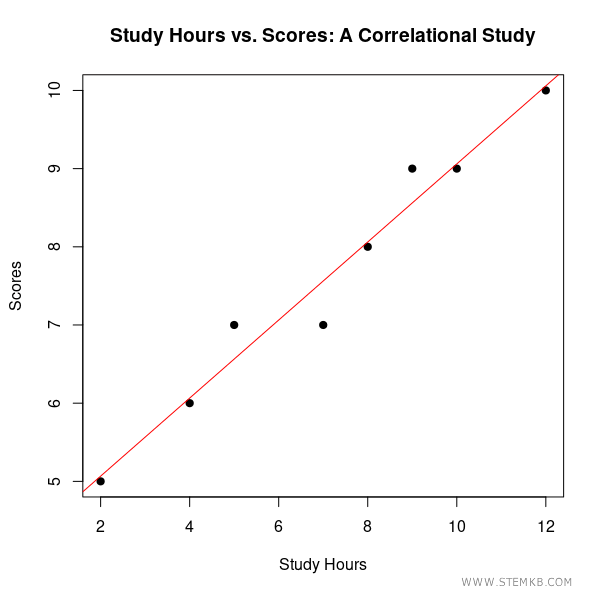
For a clearer picture, consider adding a trend line to your scatter plot.
Achieve this with the abline() function, utilizing lm() for a linear model:
model <- lm(scores ~ study_hours)
abline(model, col="red")
This technique overlays a red line that best fits the data, offering a clearer view of the relationship's direction between study hours and scores.
Scatter plots excel at making complex relationships clear and understandable.
They enable you to explore your data beyond mere numbers, uncovering insights that could easily be overlooked.
The essence lies in interpretation: your data narrates a story, awaiting your keen analysis.


