
3D Graphs with Matlab
Let's talk about three-dimensional graphs in Matlab. This is an online lesson where I'll explain how to create them.
So, what exactly is a 3D graph? It's a graph that's represented in three dimensions on the x, y, and z axes. Often, it's used to represent mathematical functions f(x, y) with two independent variables, z = f(x, y). Here's an example of a 3D graph created with Matlab.
Now, let's go through a practical example.
First, create an array with the values of the x-axis from -10 to 10. We can do that with the command linspace(-10,10,50)
>> x = linspace(-10,10,50)';
Now, create an array with the values of the y-axis from -10 to 10. This can also be done with linspace(-10,10,50).
>> y = linspace(-10,10,50)';
Both arrays x and y have 50 elements inside.
Next, type the function meshgrid() to create the matrix of points on the xy plane and assign it to arrays xx and yy.
>> [xx,yy]=meshgrid(x,y);
Then, you just need one more array. Define the array with the values of the function you want to represent.
For example, let's create the array for the function f(x,y)=x2-y2 in the variable z.
>> z=xx.^2-yy.^2;
Finally, type mesh(x,y,z) to draw the 3D graph indicating the x, y, z coordinates in the parentheses.
>> mesh(x,y,z)
Matlab will display the 3D graph of the function z=x2-y2 in the 3D space.
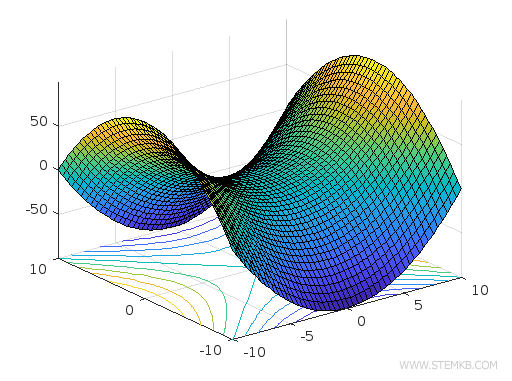
To display the contour lines on the xy plane of the graph, type meshc(x,y,z).
>> meshc(x,y,z)
This will add the contour lines below the graph.
What are contour lines? Contour lines (or level lines) are the projection of heights onto the horizontal plane (xy). They allow you to analyze the height of the function on a two-dimensional diagram. The innermost areas of the contour lines indicate higher levels. For example, on geographic maps, contour lines are used to represent the height of mountains and the depth of seas.
Alternatively, you can use the function meshz()
>> meshz(x,y,z)
This function displays the vertical projection of the graph on the base.
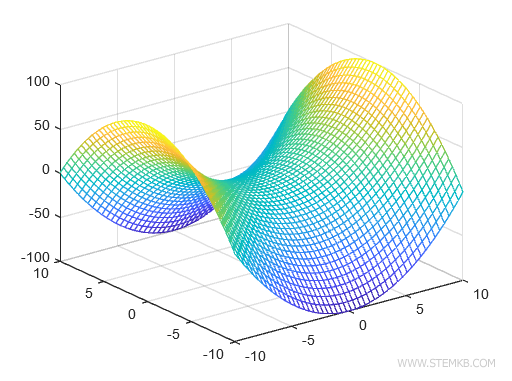
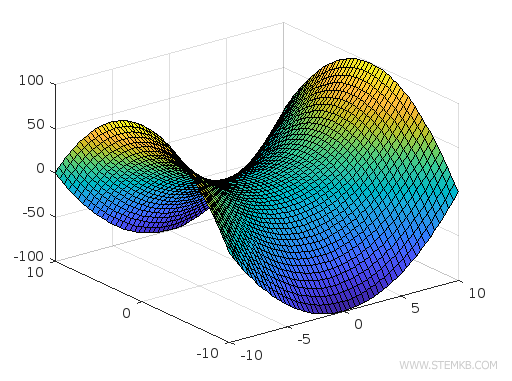
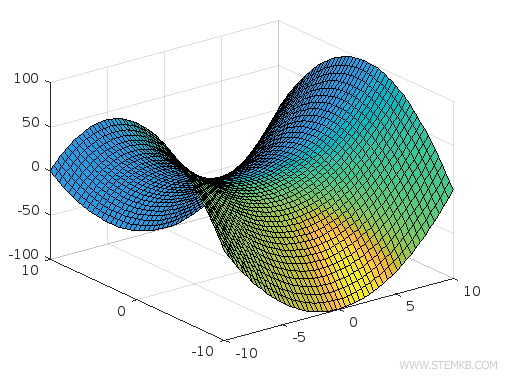
Another useful function to represent 3D graphs is surf().
>> surf(x,y,z)
This function allows you to color the surface of the 3D graph.
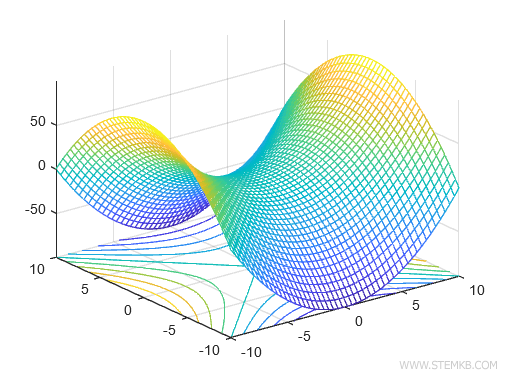
To add contour lines on the xy plane, use the function surfc()
>> surfc(x,y,z)
This function adds contour lines on the xy plane.
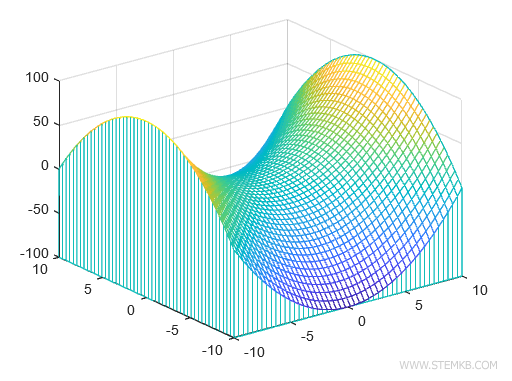
Finally, to modify the lighting effects on the 3D graph, use the function surfl()
surfl(x,y,z)
This function adds lighting effects to the surface of the graph.
With these functions, you can draw any mathematical function in three dimensions on Matlab.


