
Stem Plots in Matlab
Let's dive into stem plots in Matlab today.
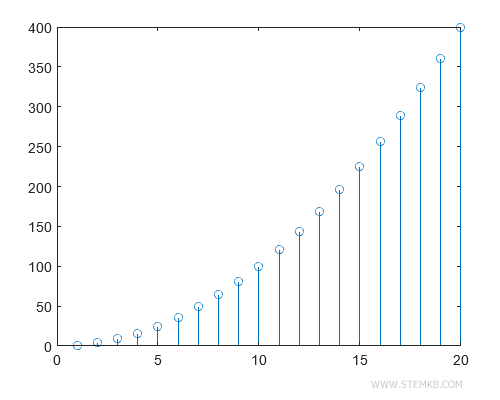
Now, what is a stem plot? In stem plots (sometimes called stem graphs), your data is shown using equally spaced "stems" sticking out like little branches. It's just another nifty way to represent a discrete function. Here's a stem plot for you
Let's walk through a hands-on example.
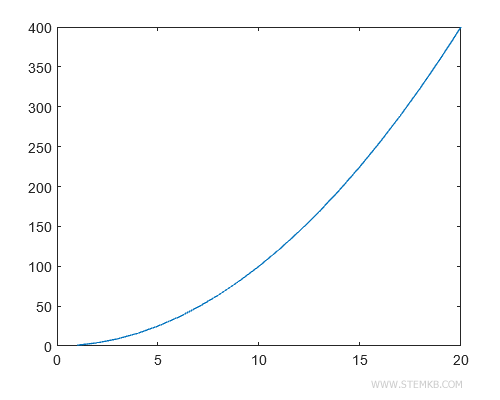
First off, you'll want to define an array x with values ranging from 1 to 20.
>> x=linspace(1,20,20);
Now, we'll define the array for the codomain of the function y=x2
>> y=x.^2
Now type plot(x,y) to draw the graph of the function
>> plot(x,y)
What you see here is the function plotting the data on a Cartesian diagram, and it's doing so continuously.
Now, let's switch things up a bit. Type stem(x,y) or stem(y) to represent the same data using a stem plot.
>> stem(x,y)
And there you have it: the function displayed in a stem plot.
It's just another clever way to represent data discreetly, don't you think?


