
Multiple Plots in Matlab
Imagine you have a set of data points and want to visualize them in Matlab. Now, let's say you have two different functions that you'd like to compare or analyze together. In this little guide, I'll show you how to display these functions in a single graphical space, either stacked on top of each other (single view) or in separate charts (multiple view).
Creating multiple plots in Matlab can be done in two ways:
Single View Multiple Plots
Let's start with a practical example.
Create an array with ten integers in a sequence from 1 to 10.
Type the command x = linspace(1,10,10)
>> x = linspace(1,10,10)
x = 1 2 3 4 5 6 7 8 9 10
Now, create two arrays y1 and y2 with values from two different functions
$$ y1=f(x) =x^2 $$ $$ y2=g(x) =x^3 $$
The first function y1 calculates the square of the x values.
Type y1=x.^2 to create the function's array.
>> y1=x.^2;
The second function y2 calculates the cube of the x values.
Type y2=x.^3 to create this function's array as well.
>> y2=x.^3
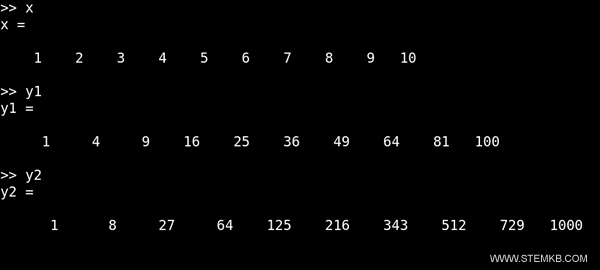
The y1 and y2 arrays (codomains) consist of ten numbers because they are images of the x array (domain).
Here are the contents of the x, y1, and y2 arrays
We can represent these functions on the same Cartesian diagram by typing the following command:
plot(x,y1,x,y2)
In this case, you need to write four parameters in the plot function.
- x,y1 for plotting the graph of function y1
- x,y2 for plotting the graph of function y2
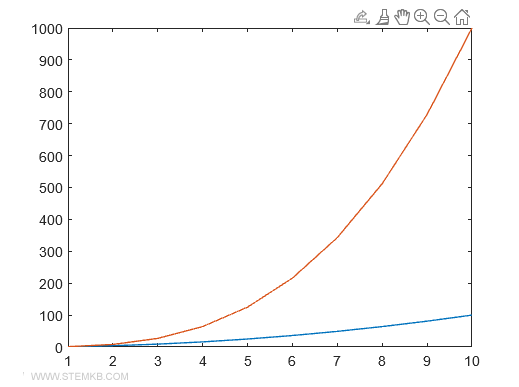
Matlab creates a multiple plot with two overlapping lines on the same Cartesian diagram. One for each function.
One line represents the graph of the square of x, while the other represents the graph of the cube of x.
Note. In the same way, you can plot three or more functions on the same graph. In this case, you will need to enter six parameters to draw three plots, eight parameters to draw four plots, etc. Matlab will automatically assign different colors to the two functions, but if you want to jazz it up, you can customize the colors, line thickness, and symbols too.
Each line of the graph is colored with a different color chosen by Matlab.
If you want, you can change the line colors
To change the colors of the plots, use these color codes in the color option of the plot() statement
- red
- green
- blue
- cyan
- magenta
- yellow
- black
- white
- none
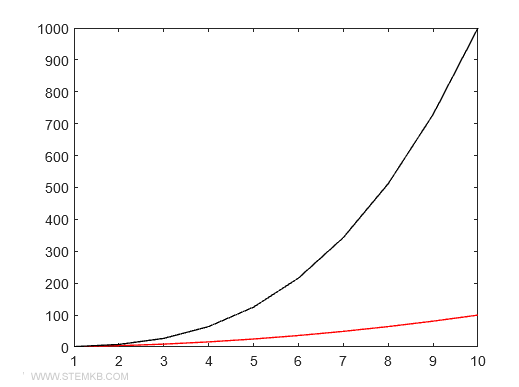
For example, to make one line red (code 1) and the other black (code 0), type
>> clf
>> hold on
>> plot(x,y1,'Color', 'red')
>> plot(x,y2,'Color', 'black')
>> hold off
The clf instruction clears the screen, while the hold on instruction modifies the plot without deleting the existing content.
The Color property allows you to choose and customize the colors of the plots.
To change the thickness of individual lines, use the Linewidth property.
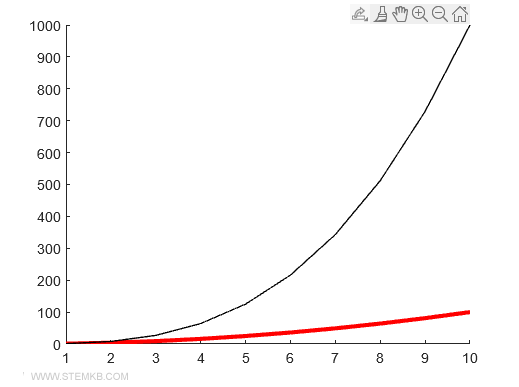
For example, draw the red line with a larger thickness
>> clf
>> hold on
>> plot(x,y1,'Color', 'red', 'Linewidth', 3)
>> plot(x,y2,'Color', 'black')
>> hold off
Now in the plot, the red line is thicker than the black line.
You can also change the marker symbols used to represent the points of each function.
The characters x, +, -, and o are allowed as markers
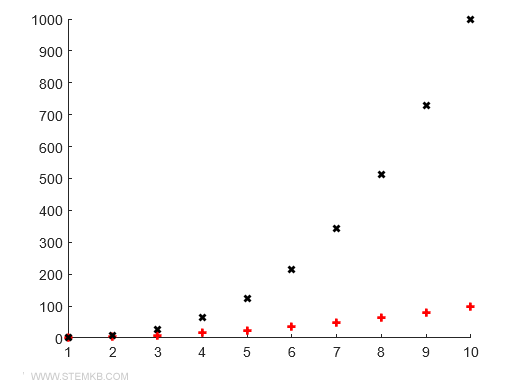
For example, to associate the + symbol with the first function and the x symbol with the second function, type
>> clf
>> hold on
>> plot(x,y1,'+','Color', 'red', 'Linewidth', 2)
>> plot(x,y2,'x','Color', 'black', 'Linewidth', 2)
>> hold off
Matlab draws the plot showing the points of the two functions on the Cartesian diagram without connecting them with a broken line.
Each function uses the marker you indicated.
Adding a Legend
If you'd like to make it even clearer, you can add a legend to your plot with this command: legend()
Enter the labels for each plot in parentheses in the same order. For example, type
plot(x,y1,x,y2)
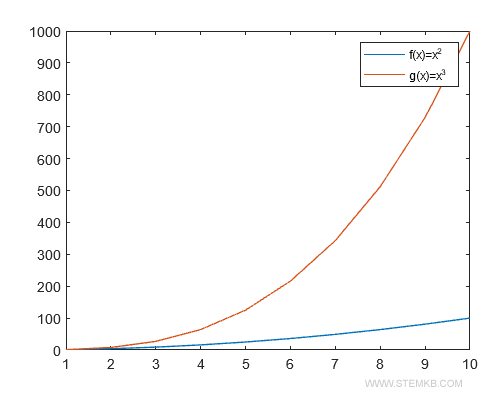
legend('f(x)=x^2', 'g(x)=x^3');
Matlab displays the legend next to the plot
Separate View Multiple Plots
Now, let's say you'd prefer to display your functions in separate charts (multiple view).
What is a separate view multiple plot? Picture dividing your graphical area into smaller sections, each containing a distinct plot. This way, you can visualize multiple functions without overlapping them.
Let's do a practical example.
Create an x array with 100 elements and two different function arrays, y1 and y2.
>> x=linspace(1,100,100);
>> y1=x.^2;
>> y2=log(x);
Divide the graphical area using the subplot(rows, columns, index) command.
Where rows and columns are used to divide the area, and the index is the plot position.
The first plot has an index equal to one. The second plot has an index equal to two. And so on.
For example, to display two plots, indicate one row and two columns.
>> subplot(1,2,1)
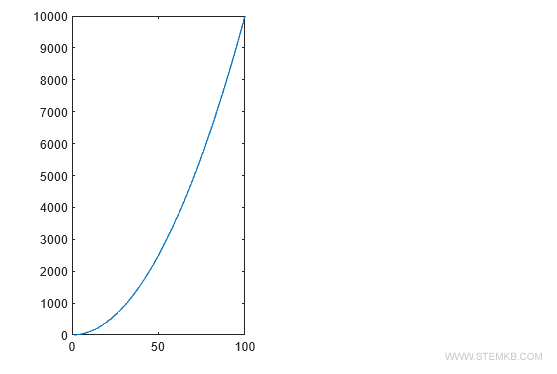
The subplot(1,2,1) command draws the first Cartesian diagram (index=1) in the first row and first column.
Type plot(x,y1) to draw the graph of function y1
>> plot(x,y1)
The plot is displayed in the first Cartesian diagram of the multiple view.
Now type subplot(1,2,2) to switch to the second Cartesian diagram (row=1, column=2, index=2)
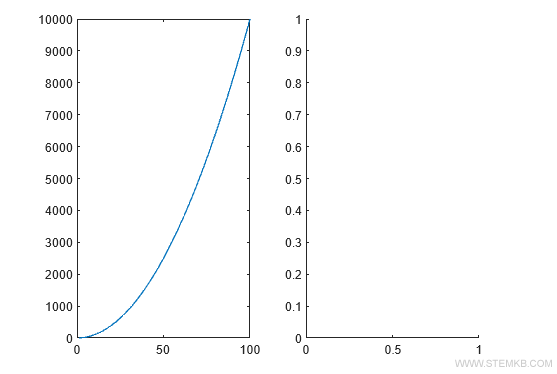
>> subplot(1,2,2)
The command displays a second Cartesian diagram next to the previous one.
It is located in the same row (row=1) but in the next column (column=2).
Now type plot(x,y2) to draw the graph of function y2
>> plot(x,y2)
The plot is drawn in the second diagram of the multiple view.
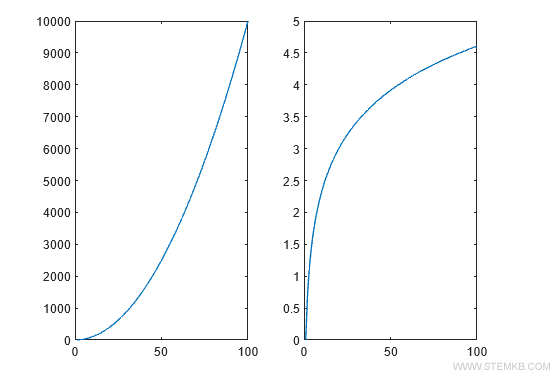
The two plots are displayed in the same graphical area but in two separate Cartesian diagrams.
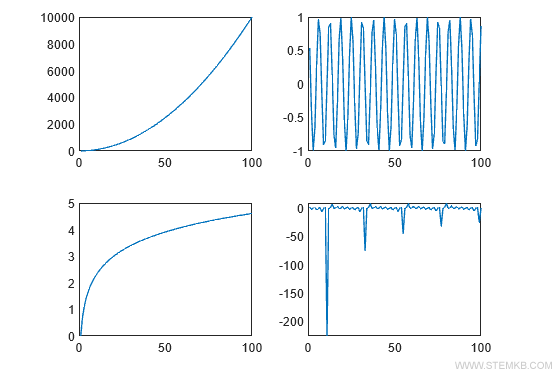
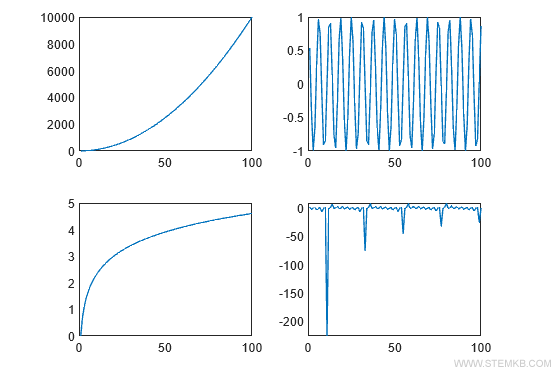
Note. You can create multiple views with more diagrams. For example, divide the graphical area into two rows and two columns by typing subplot(2,2,1), subplot(2,2,2), subplot(2,2,3), subplot(2,2,4).
>> clf
>> subplot(2,2,1)
>> plot(x,y1)
>> subplot(2,2,2)
>> plot(x,y3)
>> subplot(2,2,3)
>> plot(x,y2)
>> subplot(2,2,4)
>> plot(x,y4)
In this way, you can display four plots simultaneously in the same graphical area, in different diagrams, and without overlapping.
So, there you have it! We've explored single view and separate view multiple plots in Matlab. We've also played with customizing colors, line thickness, and symbols, as well as adding legends to make our plots informative and visually appealing.
As you practice with Matlab, you'll find it's a wonderful sandbox for creating and customizing plots.

